Baseline Evidence Paper
Other elements in this consultation

Infrastructure Delivery Plan
10.1The council published its Infrastructure Delivery Plan (IDP) in 2024 alongside the adopted local plan, which sets out the key infrastructure required to support the planned growth within the plan area (excluding the part of the district within the South Downs National Park as this is covered by its own local plan). The provision of local infrastructure is a very important issue for the development of local communities.
10.2Infrastructure planning helps to ensure that there is a common understanding between service providers, developers, local communities, and the council as to the local infrastructure needs, and to ensure that infrastructure is properly planned for, funded and provided in time with planned development in the plan area.
Transport
Travel to work
10.3Travel to employment centres take on average 7.7 minutes by car, 10.7 minutes by bicycle, and 12.6 minutes walking or using public transport (data from 2019). The respective UK averages are 7.6 minutes, 9.9 minutes and 11.5 minutes[33].
10.434.4% of people aged 16 years or over work mainly at or from home[34], whilst 46.2% travel to work by car, indicating the rural nature of the district[35].
10.5Of those who travel to work, 28% travel less than 10km, 15.7% travel between 20km and 30km, 6.3% travel between 30km and 60km, and 16% work mainly at an offshore installation, in no fixed place, or outside the UK.
Car and van ownership
10.6Given the rural nature of the district, there are high levels of car and van ownership. 40.9% of residents own one or more car and 31.1% own two or more[36]. The highest numbers of residents who do not own a car live within Chichester city and its periphery.
Access to public transport
10.739% of residents live within a 30 minute walk of their nearest railway station[37]. This is a significantly lower figure than for the whole of West Sussex, where 65% live within a 30 minute walk and 58% nationally. There are a number of railway stations that lie within the southern part of the district and plan area, but none in the National Park or the north of the plan area, therefore the figures will be skewed by this.
Connectivity Tool
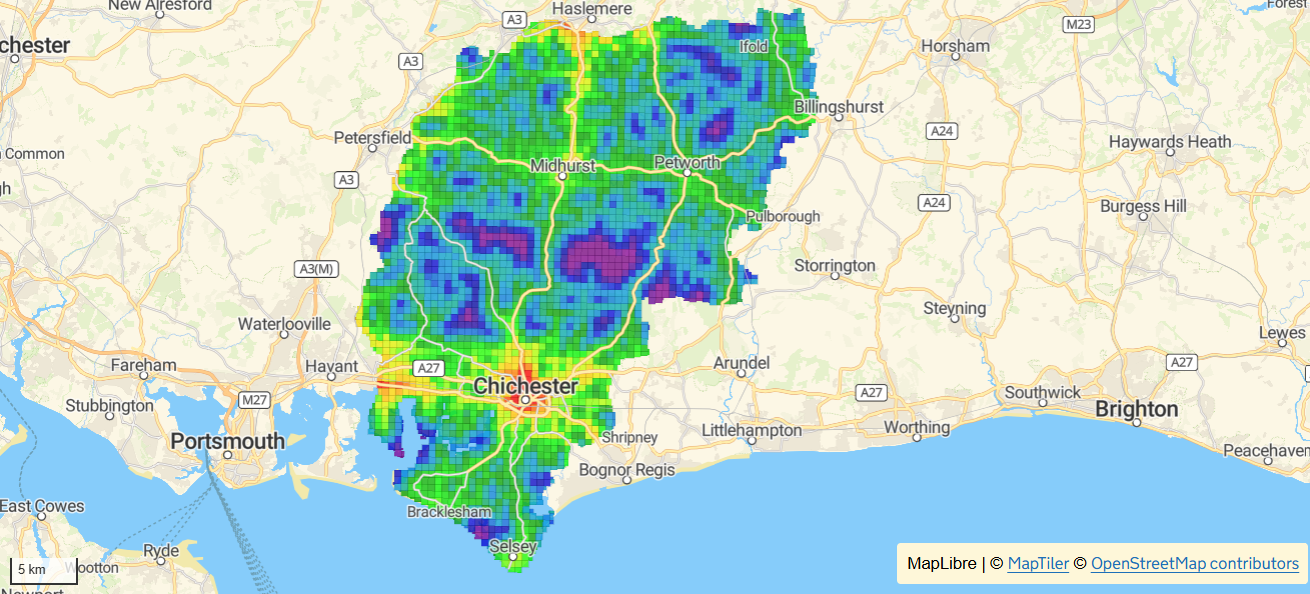
10.8The Connectivity Tool was launched by the Department for Transport in 2025, and is a national metric of connectivity that scores places in England and Wales on how well connected they are to services, education, shopping, leisure and employment. It combines transport and land-use data to generate a ‘connectivity score’ for every location at a resolution of 100 metre by 100 metre square. This score measures people’s ability to get where they want and need to go using walking, cycling and public transport.
10.9The squares are scored out of 100, with 100 having excellent connectivity and 1 having extremely limited connectivity; and are coloured to provide instant feedback with deep red illustrating excellent connectivity, yellow showing average connectivity, and black showing limited connectivity.
10.10The Connectivity Tool is available to built environment professionals, however there is a ‘lite’ version which is available to anyone without registration[38].
10.11Figure 12 shows ‘overall’ connectivity to overall destinations across Chichester district by overall mode of transport (excluding driving). Individual locations across this map would have an individual connectivity score; this would be viewable by visiting the Tool itself.
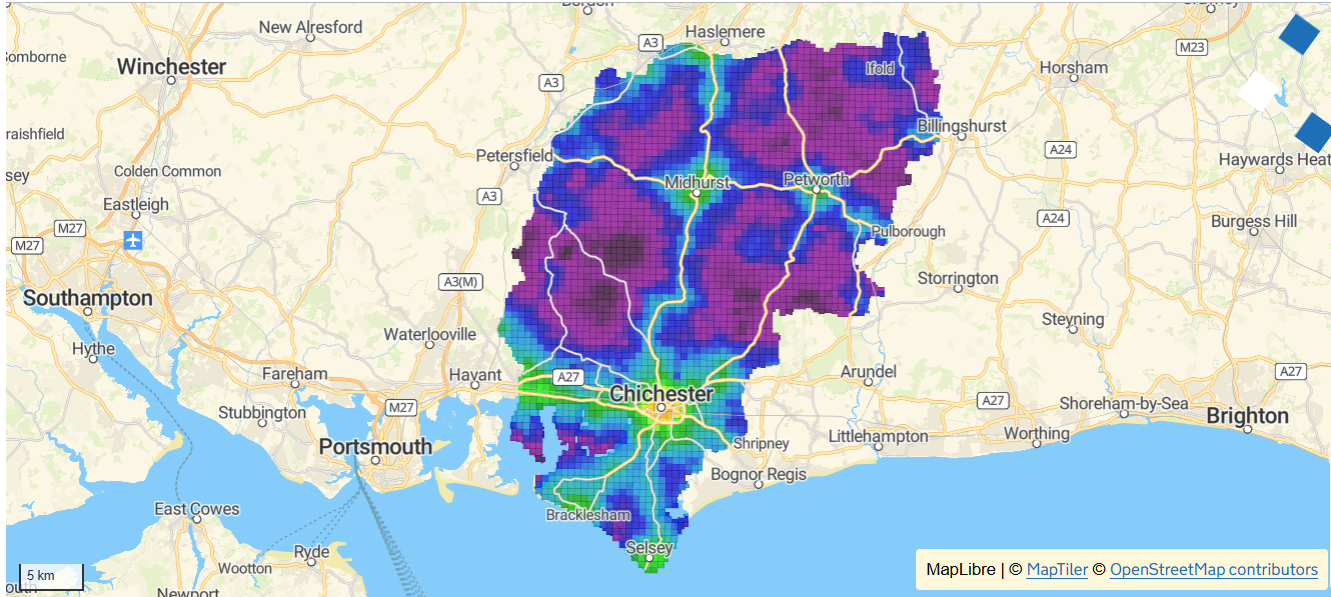
10.12The tool can be filtered to show connectivity to different destinations, including education, leisure, health, shopping, residential and workplaces; and can be further interrogated to show connectivity by different modes of transport, including walking, cycling, public transport and driving. For example, Figure 13 shows the connectivity across the district of health facilities when accessed via walking, cycling and public transport.
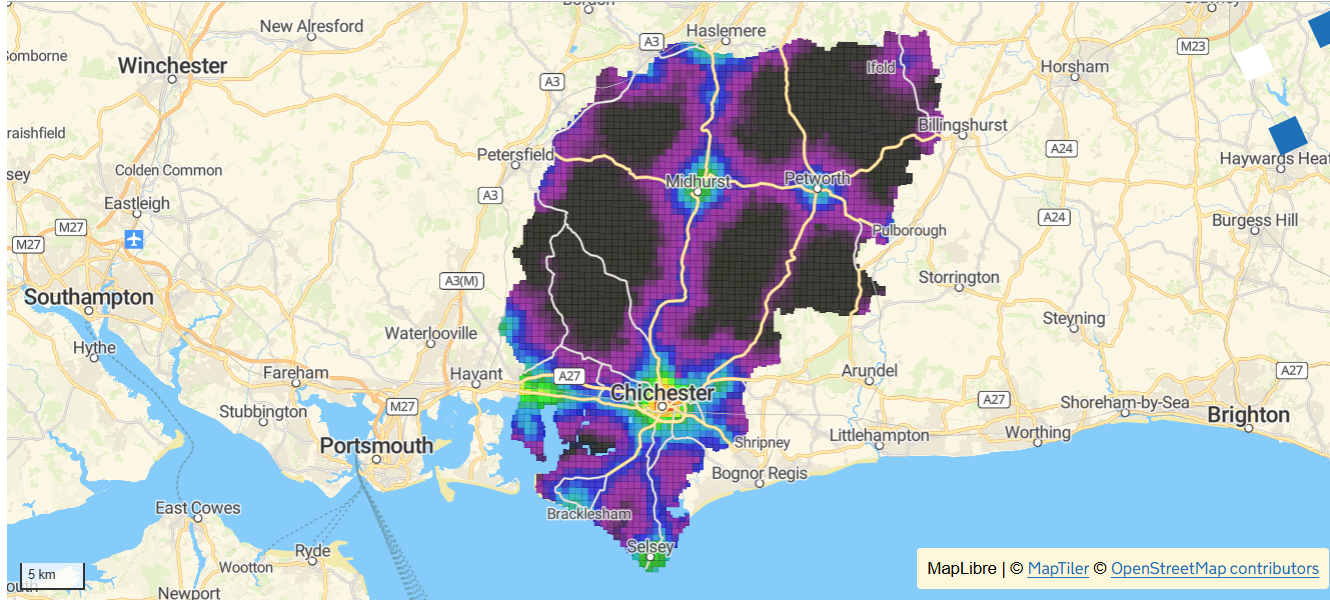
10.13 This contrasts sharply with when connectivity of health facilities is filtered by car access; this is illustrated in Figure 14 and highlights the need for car access across much of the district, including even the more densely populated southern part.
10.14Infrastructure layers are available to view on the council’s baseline map. The relevant layers will need to be selected from the layers list and ‘toggled’ on.
New Local Plan Baselining Map - Infrastructure
Amenities
10.14The ONS holds some data relating to number of amenities in the district. In terms of sports facilities, Chichester has above average, with 26.1 sports facilities per 100,000 people[39]. The national average is 17.1 (data from 2023).
10.15In 2024, 55% of residents in Chichester district live within a 30 minute walk to their nearest library, compared to 78% of residents nationally[40].
10.16More data relating to amenities such as schools and GP surgeries (as well as other infrastructure layers) are available to view on the council’s baseline map. The relevant layers will need to be selected from the layers list and ‘toggled’ on.
Local Plan: New Local Plan Baselining Map - Amenities
[33] Travel time to employment centre by bicycle - ONS
Travel time to employment centre by car - ONS
Travel time to employment centre by public transport and walking - ONS
[34] These figures may be influenced by the date of the Census during the Covid-19 pandemic, when home working was encouraged, and a number of workers were furloughed.
