Baseline Evidence Paper
Other elements in this consultation

8.1The West Sussex Joint Strategic Needs Assessment (JSNA) sets out the health and well-being issues within Chichester district as a whole, which include an older age profile compared with England, childhood obesity, physical inactivity, and inequalities resulting from the gap between life expectance of the people in the most deprived areas compared with the least deprived increased in recent years.
8.2Health and well-being are increasingly important, and there is a wealth of local indicators measured by the Office of National Statistics.
Indices of Deprivation
8.3The English Indices of Deprivation (IoD25) measure relative levels of deprivation at local or neighbourhood level. These neighbourhoods are then ranked according to levels of deprivation relative to that of other areas, and results can be aggregated to form an overall picture of deprivation.
8.4Chichester is less deprived overall than 60% of local authority districts in England.
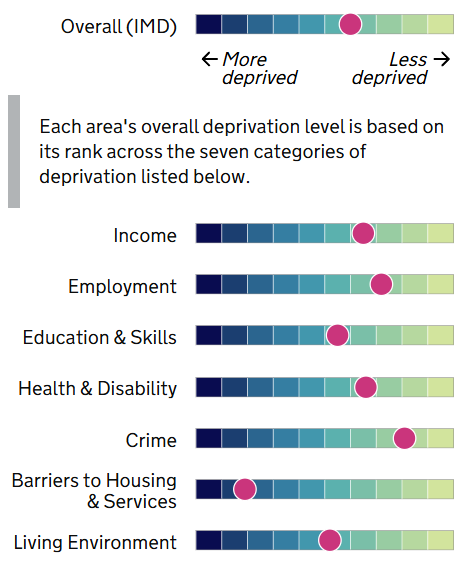
8.5Figure 10 shows the 7 factors that combine to form ‘overall’ deprivation. For Chichester the following statistics apply:
- Income: Chichester is less deprived than 65% of local authority districts;
- Employment: Chichester is less deprived than 72% of local authority districts;
- Education & skills: Chichester is less deprived than 55% of local authority districts;
- Health & Disability: Chichester is less deprived than 65% of local authority districts;
- Crime: Chichester is less deprived than 81% of local authority districts;
- Barriers to Housing & Services: Chichester is more deprived than 81% of local authority districts;
- Living Environment: Chichester is less deprived than 52% of local authority districts.
8.6When looking at the rank of all local authority districts, Chichester ranks 177 out of 296 (where 1 is the most deprived).
8.7Whilst not considered a deprived area, overall rankings do conceal that there are pockets of deprivation within Chichester when looking at lower super output area (LSOA). For example, Chichester 011B is more deprived than 95% of neighbourhoods in England when considering income deprivation affecting children.
Children in poverty
8.823% of children in Chichester are considered to be in relative poverty after housing costs. This is higher than regionally, with 21.6% in West Sussex and 20.8% for the south east, but lower than the national average of 26%[17]. Before housing costs, the figures are 13.3% for Chichester, 12.8% for West Sussex, 13% for the south east, and 19.3% nationally[18].
8.9A household is in relative low income if they have less than 60% of the income of the average household in the UK in that particular year.
8.10As a high house price area, it may be considered that the cost of housing in the district directly correlates with the numbers of children pushed into relative poverty.
Income levels
8.11Chichester has lower gross median weekly pay (full time) than the England average. This may reflect the fact that the largest sectors of the economy for the district are lower paid, for example health and the retail sectors. There is a slight disparity between the pay received by men and women, however the figures indicate that there has been a significant increase in median pay for women from the previous year[19]. This is shown in Table 9 below.
Table 9: Median weekly pay by area and gender
|
Median weekly pay 2025 |
Annual percentage change |
Male median weekly pay 2025 |
Annual percentage change |
Female median weekly pay 2025 |
Annual percentage change |
|
|
Chichester |
£696.20 |
+6.8% |
£772.50 |
+7.1% |
£657.50 |
+19.7% |
|
West Sussex |
£770.10 |
+3.2% |
£814.80 |
+2.8% |
£715.60 |
+5.4% |
|
South East |
£815.20 |
+4.5% |
£867.50 |
+2.1% |
£729.20 |
+4.6% |
|
England |
£769.50 |
+5.0% |
£824.10 |
+5.0% |
£711.60 |
+5.8% |
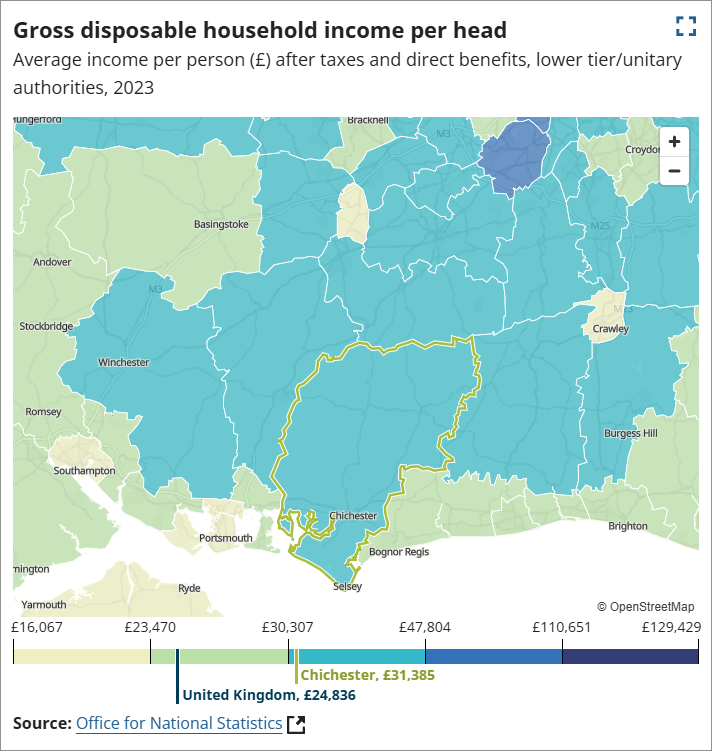
8.12Chichester has a higher gross disposable household income than the England average. The average income per person after taxes and benefits was £31,385 in 2023 compared to the England average of £24,836[20]. Figure 11 shows a comparison of Chichester within the surrounding authorities.
Educational outcomes
8.13At GCSE level, 68.8% of people achieve passes in Maths and English, compared to 74.4% across West Sussex and 73.2% in England[21].
8.14In terms of adult qualifications, 66.4% of people aged 16-64 hold a Level 3 or above qualification, compared to 71% across West Sussex and 67.4% nationally[22]. 8.9% of people aged 16-64 hold no qualifications, which is higher than the county average of 5.4% and the national average of 6.2%[23].
8.15The percentage of pupils at Key Stage 2 meeting the expected standard in reading, writing and maths in Chichester is 55%, which is lower than the West Sussex average of 60%, and the national average of 63%.
Healthy living
8.16There are a number of local indicators relating to healthy living. These include indicators considering weight and obesity prevalence, as well as mortality rates from preventable diseases.
8.17In Chichester, in the years 2024-25, the adult obesity prevalence was 18.5%, which is lower than in West Sussex as a whole (26.4%) and the south east with 24.4%[24]. The childhood obesity prevalence for Chichester (in children aged reception age) was 7.3%, which is again lower than both West Sussex and south east percentages[25], however by primary school leaver age this had increased to 19.5% for Chichester (18.4% for West Sussex, and 19.2% for the south east)[26].
8.18In terms of preventable cardiovascular mortality, which is an indicator that shows age-standardised mortality rate from cardiovascular diseases considered preventable for those aged under 75, the rate is 23.0 per 100,000 people (2022-2024)[27]. This lower than the England average of 30.2 per 100,000.
Life expectancy
8.19Life expectancy for males from birth was 80 years in 2024, and 84.8 years for females. This is above the national average of 79.2 years, and has improved since 2003 from 77.8 and 82.1 years respectively[28].
Self-reported well-being
8.20The life satisfaction indicator shows the average rating of those that feel satisfied about their lives. The average rating for Chichester in 2023 was 7.2 (where 0 is not at all satisfied and 10 is completely satisfied. This is lower than the rating of the wider West Sussex area, the south east, and the England average of 7.5[29].
8.21The average rating of happiness in Chichester in 2023 was 7.6 (where 0 is not at all happy and 10 is completely happy). This is higher than the England average of 7.4[30].
8.22The average rating of anxiety in 2023 was 3.1 (where 0 is not at all anxious and 10 is completely anxious), compared to the England average of 3.2[31].
