Baseline Evidence Paper
Other elements in this consultation

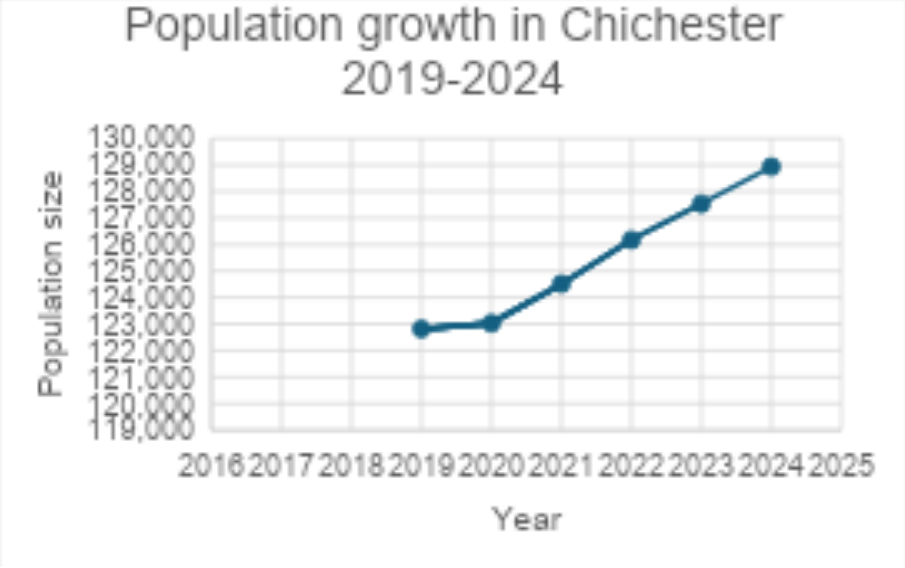
3.1In 2024, the population of Chichester district was estimated to be 128,934 people, and increase of 5% since 2019, and with a median age of 48 years. Figure 1 shows the population growth in Chichester between 2019 and 2024.
3.2By 2032, the population is estimated to be 135,792 people, an increase of 7.6% since 2022. The biggest factor in this population change is net internal migration, which is estimated to increase the population by 14,867 people. Net internal migration is predicted to be the biggest factor in population change in most areas in England.
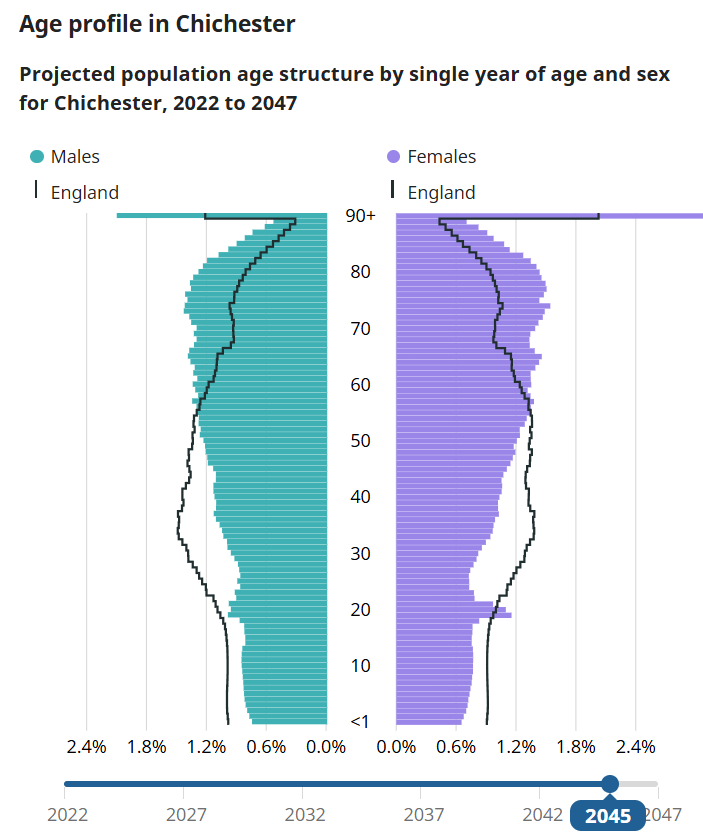
3.3The median age in Chichester is projected to rise from 48 years in 2022 to 50 years in 2032; this compares to the predicted median age of 41 years in England. By 2032, it is projected that 30% of the population in Chichester are to be aged 65 years or over, up from 26% in 2022. In contrast, the percentage of people projected to be aged 18 years or under in 2032 is estimated to be 16%, which will be below the average for England of 20%.
3.4Figure 2 illustrates projections for the area to 2045 (the end of the plan period) and indicate that there will continue to be an older population structure.
2021 Census
3.5The most recent Census was undertaken in 2021, and the analysis makes comparison between the previous Census data collected in 2011.
Population and age profile
3.6Between 2011 and 2021, the population increased by 9.1% from around 113,800 in 2011 to 124,11 in 2021. This is higher than the overall increase in England of 6.6%, and much higher than neighbouring area Havant whose population increase was around 2.9%, but lower than the increases in nearby areas of Horsham and Arun, whose populations increased by around 11.8% and 10.2% respectively. Overall, the population increase is higher than the increase for the south east of 7.5%.
3.7In 2021, Chichester ranked 190th for total population out of 309 local authority areas in England, however Chichester is the least densely populated of the 64 local authorities in the south east.
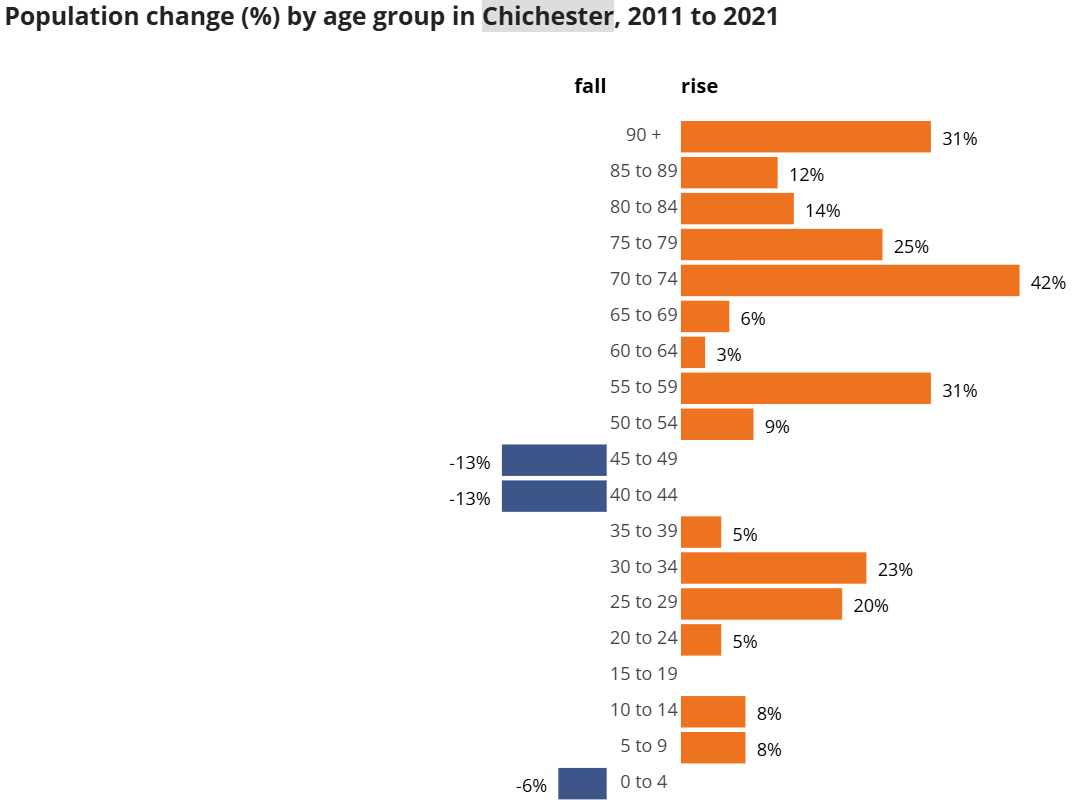
3.8The biggest population increase has taken place in the group aged 65 and over, with an increase of 20.8% between 2011 and 2021. There was an increase of 5.7% in people aged 15 to 64 years, and increase of 3.6% in those aged under 15 years. Figure 3 shows the percentage population change by age group from 2011 to 2021.
Ethnicity
3.9In Chichester, 90.1% of the population are White: English, Welsh, Scottish, Northern Irish or British, compared to 74.4% nationally. Table 1 shows the breakdown in ethnicities across the district.
|
Table 1: Ethnicity breakdown across Chichester district |
|
|---|---|
|
Ethnicity |
Number of people |
|
Asian, Asian British or Asian Welsh: Bangladeshi |
176 |
|
Asian, Asian British or Asian Welsh: Chinese |
413 |
|
Asian, Asian British or Asian Welsh: Indian |
624 |
|
Asian, Asian British or Asian Welsh: Pakistani |
61 |
|
Asian, Asian British or Asian Welsh: Other Asian |
894 |
|
Black, Black British, Black Welsh, Caribbean or African: African |
453 |
|
Black, Black British, Black Welsh, Caribbean or African: Caribbean |
218 |
|
Black, Black British, Black Welsh, Caribbean or African: Other Black |
112 |
|
Mixed or Multiple ethnic groups: White and Asian |
720 |
|
Mixed or Multiple ethnic groups: White and Black African |
293 |
|
Mixed or Multiple ethnic groups: White and Black Caribbean |
450 |
|
Mixed or Multiple ethnic groups: Other Mixed or Multiple ethnic groups |
584 |
|
White: English, Welsh, Scottish, Northern Irish or British |
111,822 |
|
White: Irish |
862 |
|
White: Gypsy or Irish Traveller |
294 |
|
White: Roma |
93 |
|
White: Other White |
5,333 |
|
Other ethnic group: Arab |
147 |
|
Other ethnic group: Any other ethnic group |
522 |
Household statistics
3.10In 2021, 31.1% of households in Chichester are one-person households, with 17.5% of this comprised of one-person households aged 66 years and over. This is a reduction of 0.9% since 2011, however remains significantly higher than the national count of 12.8%, and is reflective of the ageing demographic within the district.
3.11There are generally high levels of home ownership in the district, with 42% of households owned outright (an increase of 1.4% since 2011), and 24.8% owned with a mortgage, loan or shared ownership (a decrease of 2.8% since 2011). There has been a small increase of 1.3% in the numbers of households who rent (either socially, private or rent free). This is reflective of the general pattern of an increase in renting across England.
3.12The majority of households (82.5%) in Chichester are whole houses or bungalows, and 37% of households have 3 bedrooms, compared with 25.7% with 4 or more bedrooms, 27.6% with 2 bedrooms, and 9.6% with one bedroom.
Education
3.13Chichester is home to a variety of education facilities, including the University of Chichester. In 2021, 17.5% of the population were students, which was lower than the national average of 20.4%.
3.14There is broadly high levels of education, with 85.1% of people in receipt of qualifications. 14.8% do not have qualifications, which is lower than the national average of 18.2%. The highest level of qualification is Level 1, 2 or 3 qualifications, with 40.3% of the population having attained this, followed by 37.2% of the population having achieved Level 4 qualifications or above.
Economy
3.15In 2021 53.8% of the population were economically active: in employment, 2.6% are economically active: unemployed (including full-time students) and 43.6% are economically inactive (retired).
3.16This represents a total decline of 3.2% of economically active (both groups), and does reflect wider national trends, however it is important to note that the 2021 Census took place during the COVID-19 pandemic when disruption to the labour market through national lockdowns and the furlough schemes will have influenced results. The results are also consistent with the district’s ageing population profile.
