Baseline Evidence Paper
Other elements in this consultation

7.1The Chichester Economic Development Strategy for Chichester District 2025-2029[13] sets out the future direction for the economy, based on the evolving economic conditions of the present climate. It recommends a targeted approach to supporting (high growth potential) indigenous businesses and a focus on inward investment. It stresses the importance of horticulture, viticulture and the visitor economy, and recognises the impact of climate change and commits to supporting sustainable businesses in the sectors of renewables, retrofitting and the circular economy.
7.2The Strategy acknowledges the need to attract and retain working age people; stresses the importance of education and training in raising aspirations and developing skills; and encourages the district to continue to make economic use of its considerable natural and cultural assets.
7.3The Economic Development Strategy has main priorities:
- Inward Investment
- Supporting the high street
- Creating the conditions to support growth-oriented and sustainable businesses; and
- Making best use of the district’s natural and cultural assets.
7.4The Strategy also links strongly to the Chichester Regeneration Strategy.
Industry sectors
7.5The size of the economy in 2021 was £3.5 billion, an increase of around 35% since 2011. The biggest sectors (in terms of numbers of employees) in the district are health, retail, education, manufacturing, construction and the public sector. The biggest contributors to the economy were manufacturing (15%), health (10%) and wholesale, retail and motor repair (9%).
Businesses and employees
7.6In 2024, 6,880 businesses were recorded as being active, and 675 of these businesses had 10 or more employees. This data is fairly consistent with the preceding three years’ worth of data. 645 new businesses were established in the district in 2024[14].
7.7Table 8 sets out the numbers of businesses and the numbers of active enterprises with 10 or more employees, and the percentage change between 2019 and 2024. It is notable that Chichester exceeds the national average for the increase in number of active businesses, and is significantly higher in the percentage change in active enterprises with 10 more employees.
Table 8: Table showing Active Enterprises and percentage change 2019-2024
|
Active Enterprises 2019 |
Active Enterprises 2024 |
Percentage change |
Active Enterprises 10+ employees 2019 |
Active Enterprises 10+ employees 2024 |
Percentage change |
|
|
Chichester |
6,745 |
6,880 |
+2% |
625 |
675 |
+8% |
|
West Sussex |
38,950 |
38,800 |
-0.3% |
3,625 |
3,790 |
+4.6% |
|
South East |
447,655 |
431,000 |
-3.7% |
39,940 |
41,410 |
+3.7% |
|
England and Wales |
2,648,645 |
2,621,760 |
-1% |
253,250 |
263,555 |
+4.1% |
7.8Businesses that base themselves in Chichester district have a higher chance of survival after three years when compared to levels in the south east and nationally.
Employment rate
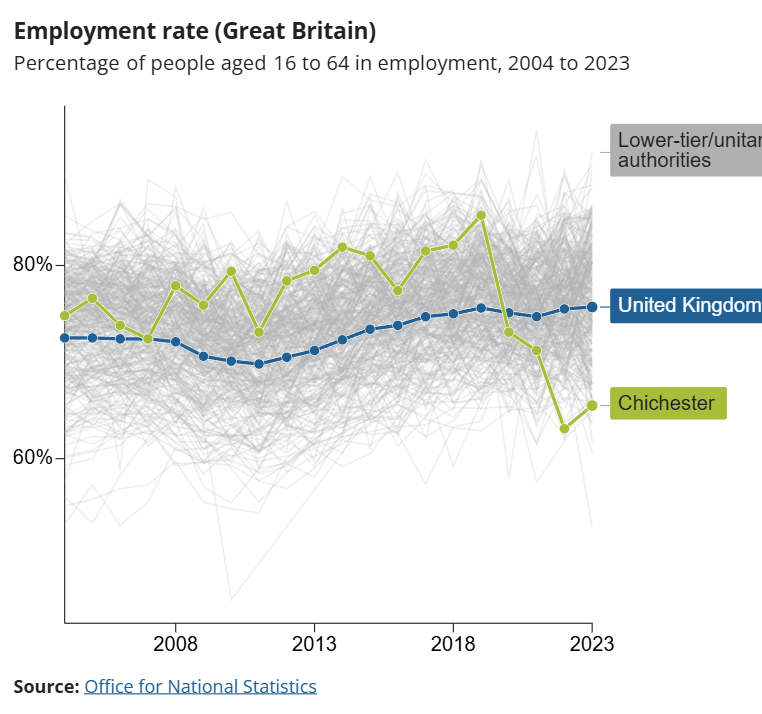
7.9Chichester’s employment rate (aged 16-64) was 65.5% in 2023, lower than the UK average of 76.6%, and significantly lower than the 2019 district rate of 85.2%. This is illustrated in Figure 8.
7.10The modelled unemployment rate for Chichester in 2023 was 3.1%, marginally higher than the South East rate of 2.9% and below the national average of 3.7%.
7.11The claimant count (the percentage of people aged 16-64 who are claiming unemployment benefits) was 3.2% in 2023, lower than the national average of 3.9%. Figure 8 Percentage change in employment rate to 2023
7.12The economic inactivity rate conversely is much higher than the national average. Economic activity rate is the percentage of people aged 16 to 64 who are not in employment or seeking work; for Chichester this rate is 32.2% compared to the England average of 21.3%. This statistic does not clarify if this includes people who are aged 16-64 and in education, as this number may be higher given the presence of educational facilities in Chichester.
Digital connectivity
7.13The district is primarily home to micro businesses (9 or fewer employees), and digital technology is critical to their success with 94% of businesses indicating that the internet is vitally important to them[15]. Increasing digital connectivity is therefore a significant growth opportunity for the UK.
7.1476.6% of Chichester has access to 5G from at least one mobile provider, compared to 82.2% across West Sussex, and 86.8% across the south east[16].
Delivery on employment allocations
7.15The adopted local plan contains several employment sites, including Land at Chichester Business Park, Tangmere, Land south of Bognor Road, and Land east of Rolls-Royce (this land is being safeguarded for the expansion of the Rolls-Royce enterprise).
7.16A total of 2.7 hectares of land allocated for Class E(g), B2 and B8 uses allocated Land at Chichester Business Park, Tangmere remains undeveloped. 2.47 hectares of the site has permission for flexible B1c and/or B8 uses.
7.17The expansion of Rolls-Royce also has full permission and is currently under construction.
Horticulture
7.18The southern part of the plan area is home to a well-established horticultural industry which has taken advantage of the comparatively high light levels in the area to become nationally and internationally competitive.
7.19Four Horticultural Development Areas (HDAs) have been designated by the council at Tangmere, Runcton, Sidlesham and Almodington. The adopted plan retains these HDAs, and includes a policy to expand the Runcton HDA in order to meet the forecast horticultural and functionally-linked development need.
7.20In the year 2024-2025, the council granted permission within the Runcton HDA for a combined heat and power system at glasshouses at Marsh Farm (24/00397/FUL and 24/00450/FUL), as well as the installation of inverters to support roof mounted solar panels at Nature’s Way Foods (24/01178/FUL). In the smaller HDAs at Sidlesham and Almodington, erection of a storage building and agricultural barn were granted permission (24/01980/FUL and 24/00374/FUL respectively).
7.21Layers relating to the economy and employment are available to view on the council’s baseline map. The relevant layers will need to be selected from the layers list and ‘toggled’ on.
