Baseline Evidence Paper
Other elements in this consultation

4.1The Met Office Annual State of the UK Climate 2024 report[2] shows that the UK climate is continuing to become warmer, wetter and sunnier, with accelerated sea level rises, and fewer frosts.
4.2As a district with a coast, as well as a reliance on horticulture and viticulture, the effects of climate change will continue to pose challenges and difficulties which will need to be mitigated.
4.3In 2019 the council declared a climate emergency[3], and in 2025 the council launched the latest Climate Emergency Action Plan 2025-2030 which sets out 11 new projects to work on, in addition to those not yet completed by the first action plan, and the outcomes will be benchmarked against the Government’s national target of net zero by 2050.
Carbon dioxide emissions
4.4In 2023, carbon dioxide emissions across the district totalled 433.3 kilotonnes. This was down from 465.5 kilotonnes in 2022 and 506.4 kilotonnes in 2021[4]. The breakdown in terms of industry sector is set out in Table 2 below.
Table 2: Carbon dioxide emissions by industry sector (2023)
|
Year |
Industry |
Commercial |
Public Sector |
Domestic |
Transport |
LULUCF* |
Agriculture |
Waste Management |
Total |
Per Capita Emissions (t) |
Emissions per km2 (kt) |
|
2020 |
38.2 |
57.9 |
27.5 |
197.1 |
250.7 |
-139.4 |
62.4 |
0.1 |
494.5 |
4.0 |
0.6 |
|
2021 |
34.2 |
64.5 |
28.8 |
198.6 |
253.1 |
-135.6 |
62.8 |
0.1 |
506.4 |
4.1 |
0.6 |
|
2022 |
30.1 |
64.7 |
27.1 |
169.8 |
248.8 |
-132.4 |
57.3 |
0.1 |
465.5 |
3.7 |
0.6 |
|
2023 |
31.3 |
61.1 |
28.0 |
160.3 |
247.1 |
-131.9 |
37.4 |
0.1 |
433.3 |
3.4 |
0.5 |
Greenhouse gas regulating
4.5Greenhouse gas regulating estimates measure the net greenhouse gas emitted and absorbed. It was estimated that £38.2 million worth of greenhouse gases were removed from the atmosphere or emitted by natural habitats in Chichester in 2023[5].
Urban heat regulating
4.6The urban heat regulating indicator estimate the value of green spaces (for example woodlands, private gardens, parks and grassland) and blue spaces (for example rivers, canals, lakes and ponds) that can cool down built-up environments on hot days (temperatures over 28 degrees celsius).
4.7In 2024, the estimated value of cooling provided by green and blue spaces in urban areas in Chichester was £500,000[6].
Air Quality
4.8The adopted Local Plan includes policies relating to air quality, including in relation to The Mens Special Area of Conservation (SAC).
4.9Air Quality Management Areas (AQMAs) are declared where air quality fails or is likely to fail an Air Quality Objective prescribed in regulations. Until very recently, there was one AQMA in the Plan Area located at St Pancras, however this has agreement from Cabinet to be revoked (7 July 2026).
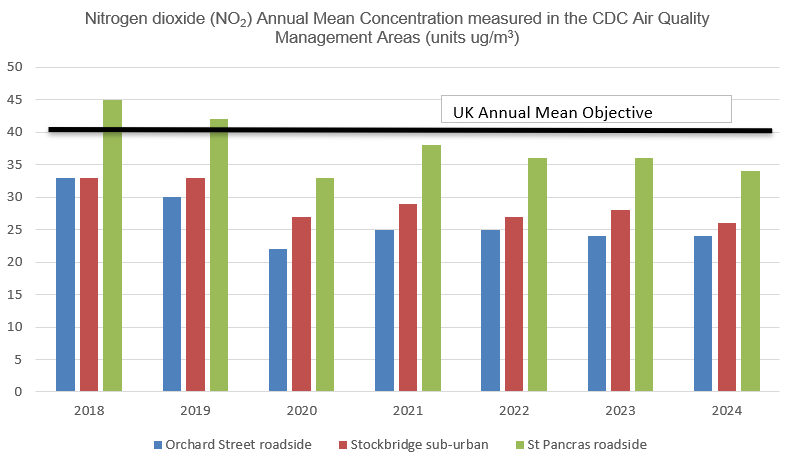
4.10Air quality monitoring data indicates that annual mean Nitrogen Dioxide concentrations continue to improve in Chichester district. The data evidences that air quality during the monitoring period (2024-2025) was compliant with the annual mean standard of 40µg/m3. Figure 4 below shows the annual mean concentration of Nitrogen Dioxide measured in the CDC Air Quality Management Areas between 2018 and 2025[7].
Air Quality and The Mens SAC
4.11Regarding The Mens SAC, there is potential for there to be a small proportion to exceed 1% of the critical level for atmospheric ammonia concentrations for beech woodland in The Mens supporting lichens and bryophytes. This is not expected to occur until the period 2032 and 2035, due to in-combination effects from development and agricultural emissions.
4.12The Horsham and Chichester Local Plans Outline Air Quality Strategy (AECOM September 2024) includes a number of specific measures to mitigate combined impacts arising from strategic local plan allocations in both plan areas, and sets out how they could be delivered to ensure that there would be no adverse effect on the integrity of The Mens SAC in relation to atmospheric pollution, specifically the levels of ammonia.
4.13If deemed necessary, the council will undertake Automatic Number Plate Recognition (ANPR) monitoring to the A272 to determine the uptake of ultra-low emission vehicles.
Flood risk
4.14The adopted local plan also contains policies relating to flood risk. Parts of the plan area will be at increased risk from coastal erosion, groundwater, fluvial and/or tidal flooding in the future due to a number of factors including some directly related to climate change such as severe rainfall and sea level rises.
Renewable energy
4.15Chichester is supportive of renewable energy schemes provided that they can be delivered with any significant impacts appropriately mitigated.
4.16The Chichester Climate Emergency Action Plan includes work towards a Local Energy Plan, which will support work that the council does to encourage homes and businesses to generate renewable energy themselves, contributing to UK energy security.
4.17Relevant climate change layers, including flood risk, are available to view on the council’s baseline map. The relevant layers will need to be selected from the layers list and ‘toggled’ on.
New Local Plan Baselining Map - Climate Change
[2] State of the UK Climate in 2024 - Kendon - 2025 - International Journal of Climatology - Wiley Online Library
[4] Department for Energy, Security and Net Zero.
[7] The AQMAs at Orchard Street and the A27 Stockbridge Roundabout were revoked on 9 May 2022.
